Success Rates
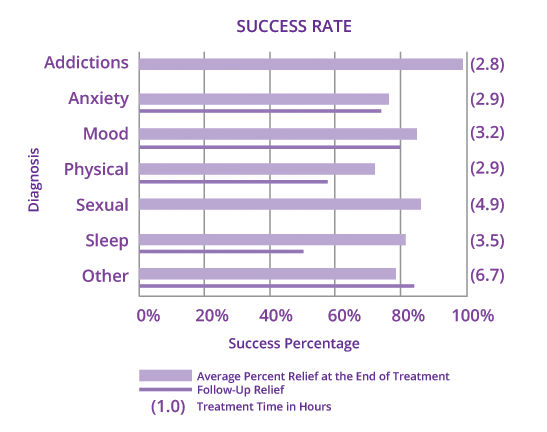
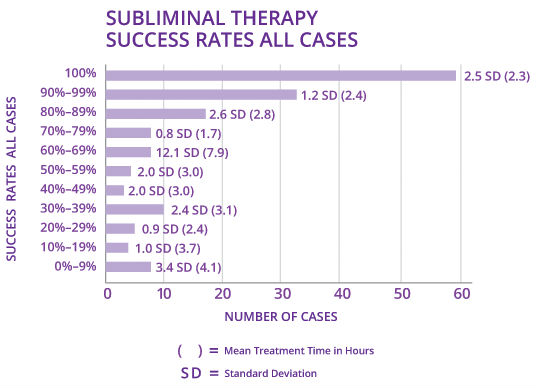
Dr. Yager has been formally researching the effectiveness of Subliminal Therapy since 2008. Since data collection began, his patients reported 77% improvement from their problems within two to six treatment hours.
The tables below are added for a closer look at the research, and if more details are desired, including raw data, they will be made available upon request to Dr. Yager at doc@docyager.com .
SUBJECTS
The subjects of this on-going clinical trial are all patients in Dr. Yager’s private practice. All 132 patients were adults with a mean age of 38 years, most of whom presented more than one problem. Sixty-two patients were male, 70 were female. Of the 251 problems reported, 113 were presented by males and 138 were presented by females. Twenty patients were excluded from the study because of incomplete treatment.
DATA COLLECTION
Patients were asked to complete a brief inventory at the initial session, at the conclusion of treatment, and again as a follow up. The form used was a one-page inventory of the effects the presenting problem was having on the patient’s life. Fifteen questions were asked and the patient was requested to indicate the degree of effect in each area by marking on a continuum representing “Not at all” to “Severe.” In the event more than one problem was presented, a separate form was used for each problem. (See example of Yager Subjective Effects Inventory)
DATA COLLECTION
The data was quantified by assigning a 0-to-10 value to the continuum of each question, recording the value marked thereon, and averaging the scores. The averaged before-and-after scores were then evaluated using Effectiveness and the Effect Size computations of Cohen’s d and r.
DATA PROCESSING
Data presented in the following graphs and tables are obtained from the inventory described above. Summaries of the data are presented in the tables and graphs that follow. These success rates apply as of December 2013.